


Embedded Feature Selection in Machine Learning.
Choosing the right features to predict the right results.


The increase in data size over the past few years has drawn the attention of machine learning developers to focus on quality over quantity. Why? Substandard data, no matter how large, will produce substandard results. Feature selection is one of the methods engineers use to ensure quality in data.
In this article, we will go over:-
- What is Feature Selection?
- Benefits of Feature Selection.
- Embedded Methods of Feature Selection with code.
What is Feature Selection?
Feature selection is the process of selecting a subset of features in data when building a model by removing irrelevant and redundant features without much loss on the information. Features here refer to the variables in the data.
In a data whose features are to predict whether a child is getting a good education or not, features such as the child's school, the school neighborhood are appropriate, but the child's shoe size isn't. The purpose of feature selection is to dig out the relevant features.
Benefits of Feature Selection.
- It reduces computation time: The developer on applying feature selection can find the right features, remove the irrelevant ones, thereby reducing file size and computation time.
- It improves the model's accuracy: Data with relevant features and a strong correlation with the target variable enables the algorithm to predict better.
- It identifies relevant features for a specific problem: Feature selection ranks features in order of relevance. Developers can use this to find the features that matter to the problem.
- It reduces the dimensionality of the data: Selecting just the right features decreases the size of the data. The smaller the data, the smaller its dimension. It reduces the dimensionality of the data: Selecting just the right features decreases the size of the data. The smaller the data, the smaller its dimension.
Embedded Methods of Feature Selection with Code
The three methods are :-
- Filter method: This method applies feature selection by using statistical tests to check the correlation of features to the target variable. This selection is independent of a machine learning algorithm. Examples of statistical tests are Chi-Square, Analysis of Variance, Pearson's Correlation and, Linear Discriminant Analysis
- Wrapper Method: Several subsets with different features are selected and trained on a model to find the best accuracy score. This operation is carried out by adding and removing these features from a set and is computationally expensive. Examples are Forward Feature Selection, Backward Feature Elimination and, Recursive Feature Elimination.
- Embedded Method: It combines both the wrapper and filter method. Developers can apply this with algorithms that have built-in feature selection methods.
We will focus on Embedded Feature Selection in this article.
Let's consider the data used in this article below.
Data
The data used is the White Wine Quality Dataset and, you can get it here, together with the code.
Let's import our standard packages, NumPy and Pandas.
import pandas as pd
import numpy as np
Next, we read our data and visualize it.
wine_data = pd.read_csv('whitewine-quality.csv')

wine_data.head()
Output
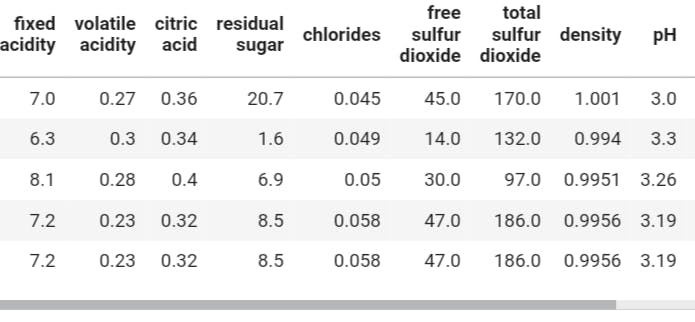
Features contained in this data are:-
- Alcohol
- Citric Acid Content
- Volatile Acidity
- Density
- Total Sulphur Dioxide
- Free Sulphur Dioxide
- Residual Sugar
- pH
- Sulphates
- Chlorides
- Fixed Acidity.
Some of the dataset use cases are:-
- Helping manufacturers know what to focus on during production.
- Help store owners select the wines 🍷 based on the product's specifications.
Feature Selection with Pearson Correlation
Pearson Correlation checks the correlation of the independent variable to the target output. The correlation score ranges from -1 to 1, and two features are strongly correlated if they tend towards the positive side.
We'll use the Pandas attribute .corr() to give the correlation score and the Seaborn library to visualize the correlation matrix.
import seaborn as sns
corr = wine_data.apply(lambda x : pd.factorize(x)[0]).corr(method='pearson', min_periods = 1)
plt.figure(figsize=(16,6))
heatmap = sns.heatmap(Corr, annot=True, cmap='RdYlGn')
heatmap.set_title('Correlation Heatmap', fontdict={ 'fontsize' : 12 }, pad = 12);
Output
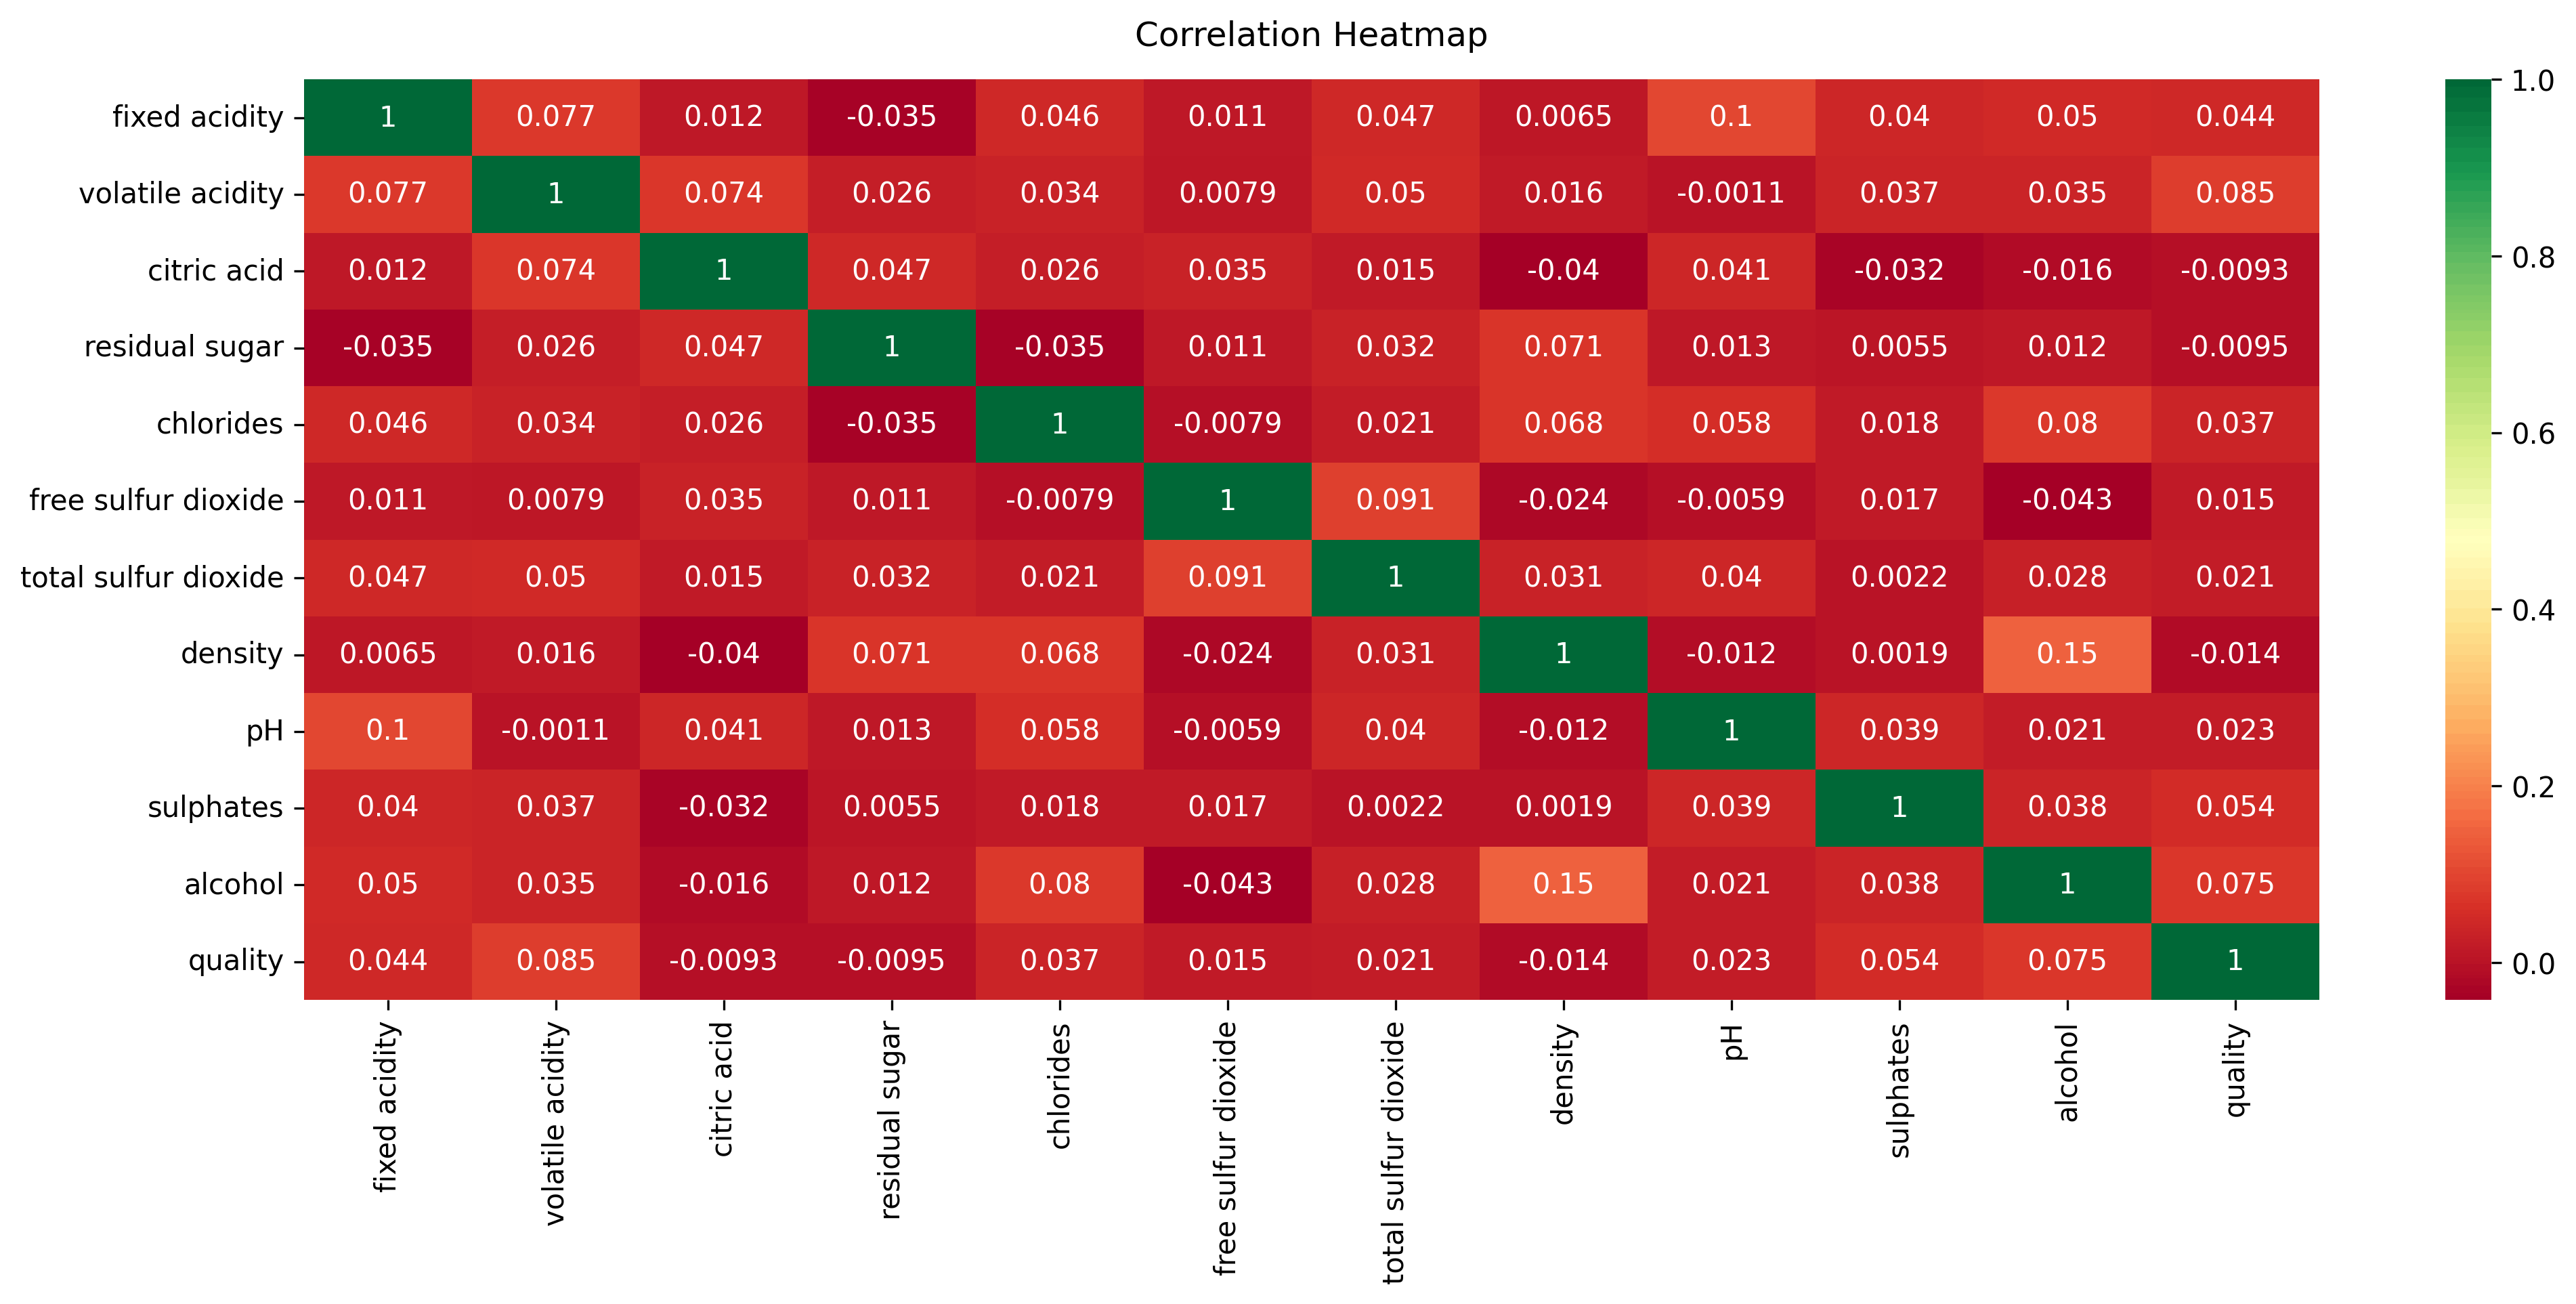
The result is a heatmap of the correlation scores between the features. We'll focus on the correlation between the target output (quality) and other independent features.
Take a close look at the bottom row of the heatmap and see the scores between the target output and independent features. The scores that tend towards the positive have bright backgrounds and represent the relevant features. These features are Fixed Acidity, Volatile Acidity, Alcohol, Sulphates and, Chlorides.
Check out the feature importance method to see its results.
Feature Selection by Feature Importance
Tree-based algorithms have the feature importance attribute because of the way they operate, which is, they work on data piece by piece to deconstruct the problem and find the best approach. Deconstructing the problem helps to know what is essential, in our case, the relevant features.
To implement this method, choose an algorithm from any Tree-based algorithm. For the sake of this tutorial, we will make use of the Extra Tree Classifier since we're solving a classification problem.
Moving forward, import the classifier, separate the independent features and target output into X and y variables, and fit them to the model.
from sklearn.ensemble import ExtraTreesClassifier  #importing the model
model = ExtraTreesClassifier() # creating an instance of the model
X = wine_data.iloc[:,0:11] # variable X containing the independent variables
y = wine_data.iloc[:,-1] # variable y containing the target variable
model.fit(X,y) # fitting the data to the model
Next, call the feature importance attribute.
model.feature_importances_
Output
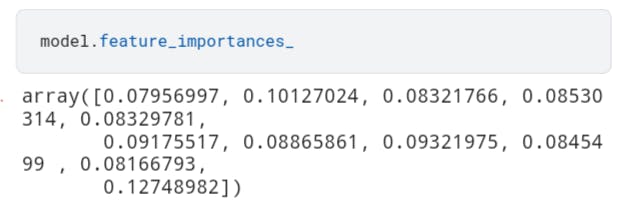
The result is an array of the feature score in array form. To make the results more visible, place them into a table using pandas, add the column names and plot the top 10 most important features.
feature_importances = pd.Series(model.importances_, index=X.columns)
feature_importances.nlargest(10).plot(kind='barh')
plt.show()
Output
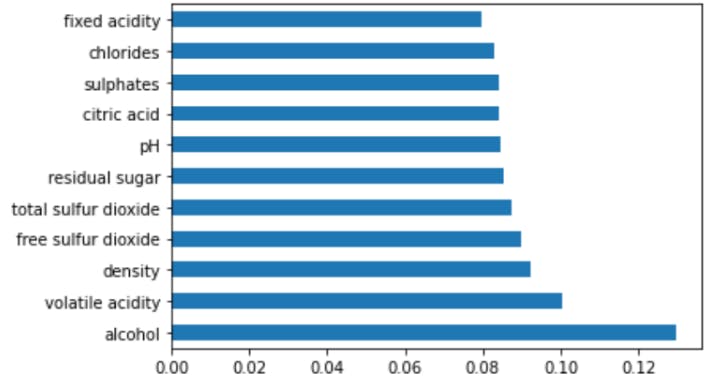
From the figure above, the top 5 features are Alcohol, Volatile Acidity, Density, Free Sulphur Dioxide and, Total Sulphur Dioxide.
Now, check the Univariate Selection method to see if the result will be different.
Feature Selection by Univariate Selection.
Univariate selection works on the filter method. It employs any statistical test to rank features based on their correlation to the target output. It operates using the SelectKBest class and ranks features independent of the machine learning algorithm, as is the characteristic of the filter method.
To begin, import the needed libraries using the code below:-
from sklearn.feature_selection import SelectKBest
from sklearn.feature_selection import chi2
Next, create an instance of the SelectKBest algorithm, choose a score function (Chi-Square), set the number of features(k) and, fit the data to SelectKBest.
best_features = SelectKBest (score_func=chi2, k = 'all')
fit = best_features.fit(X,y)
Next, aggregate the scores and their respective features into a pandas DataFrame and display the result.
dfscores = pd.DataFrame(fit.scores_)
dfcolumns = pd.DataFrame(X.columns)

result_ = pd.concat([], axis = 1, ignore_index = True, names = ['features','scores']
result_.columns = ['features', 'scores']

result_ #Displaying the data frame.
Output
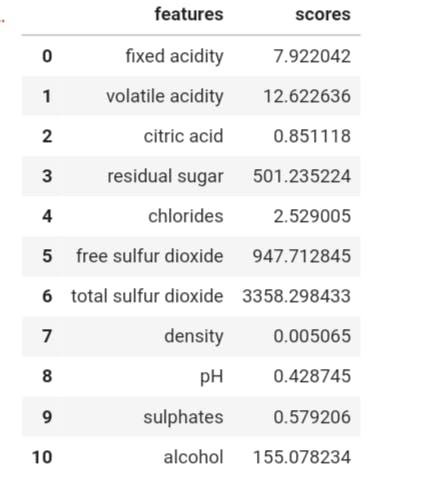
The result is not too orderly. Let's sort it from the highest score to the least and return the results.
print(result.nlargest(11, 'scores'))
Output
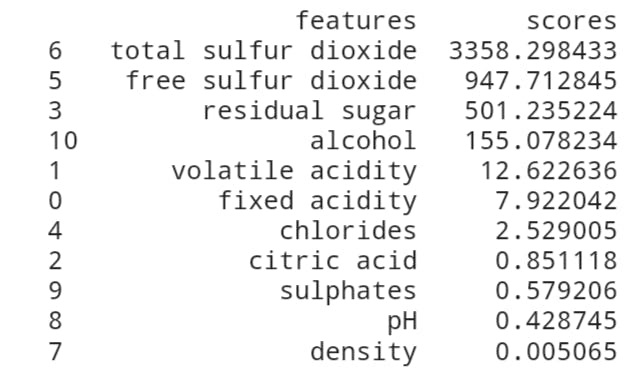
Here, the top five features in terms of importance are Total Sulphur Dioxide, Free Sulphur Dioxide, Residual Sugar, Alcohol and, Volatile Acidity.
Conclusion
A close look at all the results we got above will indicate that some features were always in the top 5 in all three methods. They are Alcohol, Total Sulphur Dioxide, Free Sulphur Dioxide and, Volatile Acidity. These are the features with the highest impact on the target variable.
Moving forward, you can read up the following as you process your data.
I hope you learned something about feature selection and how to apply it in code. Thank you for taking the time to read through. Make sure to share this with anyone who will need it, and till we meet again, stay safe.