

How to Create a Web App Using Machine Learning and Flask to Calculate Calorie Burned During a Workout.
The only bad workout is no workout.


Outline:
- Introduction.
- Understanding the Data.
- Preprocessing the Data.
- Analyzing the Data.
- Building the Model.
- Deploying the Model with Flask.
- Conclusion.
Introduction
According to Rx Resource.org, less than 5% participate in 30 minutes of physical activity each day; only one in three adults receive the recommended exercise each week. Only 35 - 44% of adults 75 years or older are physically active, and 28 - 38% of adults ages 65-74 are physically active.
To solve the problem of inaccurately estimating calories burned, you will build a web application using Flask that predicts the number of calories burned during a workout session. It is required that you have good knowledge of Python, Flask, and Machine Learning libraries like Pandas, Numpy, and Sckit-learn.
Understanding the Data
The data contains information about the gender, age, height, weight, heart rate, and body temperature of an individual. This information allows asking interesting questions, such as;
- Which gender burned more calories on average?
- Do people who weigh more burn more calories than those who weigh less?
- How significantly does the time spent working out affect how many calories you lose?
- Do younger people burn more calories than older ones?
Also, you can draw out hypotheses from the data, for example; The longer the time spent exercising, the faster your heartbeat, the higher your body temperature, and the more calories you burn. Answering these questions builds your understanding of the data and helps you solve the problem better.
Preprocessing the Data.
You can download the dataset from here.
Import the Pandas library and read the data to get started.
import pandas as pd
calories = pd.read_csv('data/calories.csv')
exercise = pd.read_csv('data/exercise.csv')
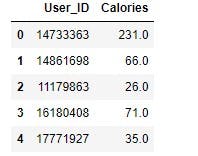
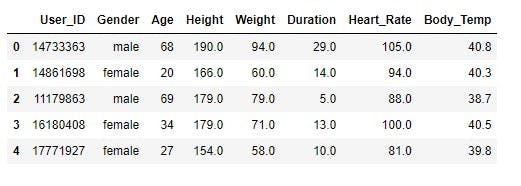
Now, view the first five rows of the data using Pandas pd.head() method.
calories.head()
Output:
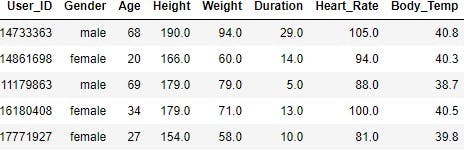
exercise.head()
Output:
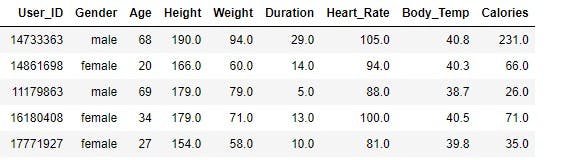
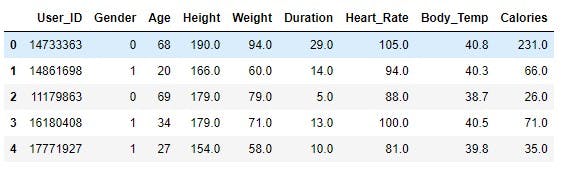
Next, concatenate the data using pd.concat() to get a complete sense of what it represents.
calories_data = pd.concat([exercise, calories['Calories']], axis=1)
Here, exercise.csv and calories.csv were concatenated with the User_ID in calories.csv left out as it is redundant. Set axis toperform column-wise concatenation.
The result,
calories_data.head()
Output:
Next, go on to analyze the data.
Analyzing the Data
Data analysis is a process of inspecting, cleansing, transforming, and modeling data to discover useful information, informing conclusions, and supporting decision-making - Wikipedia.
In this section, you will analyze the data and answer questions concerning the data.
Checking for missing values in your data is always a good start when analyzing your data, as missing values in your data tend to produce skewed or wrong results.
Check for missing value using pandas pd.isnull().sum() method.
calories.isnull().sum()
Output:
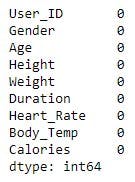
No missing value.
Next, get the number of observations and features using Pandas pd.shape attribute to get the amount of data present.
# Checking data info
calories_data.shape
Output:
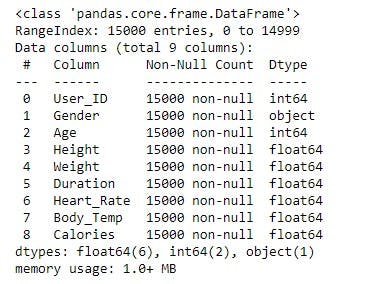
From the result, we have 15000 observations and nine features.
Next, get statistical information about the data using Pandas pd.describe() method, this will come in handy when answering related questions about the data.
# Get some statistical information about the data
calories_data.describe()
Output:
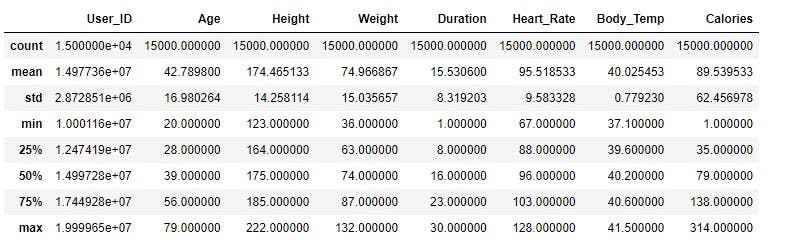
This method gives a clear insight into numerical features such as the minimum value, the mean, the maximum value, standard deviations, and percentiles. For example, from the table, you could easily spot the age range of people in the data, the maximum calories burned, the average time spent working out, among other features.
Asking and answering questions is a crucial aspect of the analytics process. It helps you question assumptions and get deep insights into the problem.
First question, which gender burned a higher number of calories on average?
Answering this question requires you to group the data by gender and use the mean() method to calculate the average.
calories_data.groupby(['Gender']).mean()
Output:
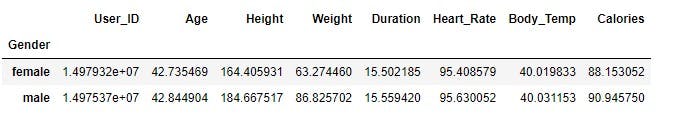
Men burned more calories than women on average. Also, you will find out that men were taller than women, and they weighed more. In addition, both genders averaged a similar amount of time spent doing workouts, heart rate frequency, and body temperature.
Next question, do the older folks burn more calories than the younger folks?
A logical assumption here is that younger folks burn more calories because they can spend more time working out when compared to older folks.
To verify this, the question of what age decides if a person is young or old. It varies, depending on whom you ask. In this article, the 50th percentile will be the deciding factor. 39 is the 50th percentile when you look at the statistical table we created above, meaning those age 39 and below are considered younger, and those above older.
The function below compares a feature with respect to another, using the 50th percentile as the dividing line. The feature_one and feature_two parameters refer to the features compared to one another. The separator is the value of the 50th percentile. The column_one and column_two parameters are string values for our DataFrame.
def ranges(column_one, column_two, separator, dataframe, range_one, range_two):

    #  create a dataframe using the range string values
    d = {range_one : [0], range_two : 0}
    dataframe = pd.DataFrame(index=[column_two], data = d)
    data_length = calories_data.shape[0]
    count_one, count_two = 0,0

    # iterate through the dataset and add all the values that falls below and above the 50th percentile
    for number in range(data_length):
        if calories_data.loc[number, column_one] <= separator:
            dataframe[range_one] += calories_data.loc[number, column_two]
            count_one += 1
        else:
            dataframe[range_two] += calories_data.loc[number, column_two]
            count_two += 1

    # calculate the average
    dataframe[range_one] = dataframe[range_one]/count_one
    dataframe[range_two] = dataframe[range_two]/count_two

    return dataframe
Call the function, and pass in the parameters to answer the question.
did_older_folks_burn_more_calories_than_younger_folks = 0
ranges("Age","Calories",39, did_older_folks_burn_more_calories_than_younger_folks,"Younger folks","Older folks")
Output:
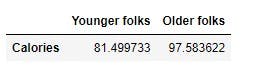
Looking at the results, older folks burned more calories than younger ones.
Next question, do people who weigh more burn more calories?
The 50th percentile for weight is 74 kilograms, hence call the function, passing Weight and Calories as the features to compare, and 74 as the separator.
which_weight_group_burn_more_calorie = 0
ranges("Weight","Calories",74, which_weight_group_burn_more_calorie,"36-74","75-132")
Output:
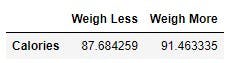
Judging from the results, those who weigh more burn more calories than those who weigh less on average.
Next question, How significantly does the time spent working out affect how many calories you lose?
More time spent working out is anything higher than 16 minutes since it is the 50th percentile.
spend_more_time_working_out = 0
ranges("Duration","Calories",16,spend_more_time_working_out,"More Time (>= 16 mins)","Less Time (< 16 mins)")
Output:
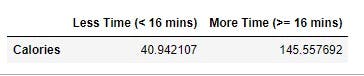
On average, those who spent long periods working out burned way more calories than those who spent less time.
Last question, do taller folks burn more calories than the shorter folks during workouts?
The 50th percentile for height is 175 centimeters. Call the function, passing Height, and Calories as the features to compare, and 175 as the separator.
who_burns_more_calories_taller_folks_or_shorter_ones = 0
ranges("Height","Calories",175,who_weighs_more_taller_folks_or_shorter_folks,"Shorter Folks","Taller Folks")
Output:
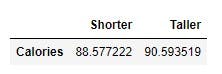
From the results in the table above, people burn similar amount of calories regardless of their height.
You could find the correlation between the features using Pandas pd.corr() method and visualize the result using heatmap in Seaborn.
The end goal of machine learning is to build an accurate model that can predict precisely and generate new insights.
Building The Model.
calories_data.head()
Output:
The male and female value in the gender column needs to be replaced with numerical values, as machine learning algorithms work with numerical data.
To replace the categorical values with numerical values, use Pandas pd.replace() method.
# Convert text data to numerical values
calories_data.replace({"Gender":{'male':0, 'female':1}}, inplace=True)
Output:
Next, remove the User_ID column, as it is irrelevant in helping predict the target variable, and split the data into independent and dependent variables.
X = calories_data.drop(columns=["User_ID", "Calories"],axis=1) #droping User_ID, column and splitting feature variables
y = calories_data["Calories"] #splitting the target variable.
Next, import Gradient Boosting Regressor, the choice model for this tutorial, and use cross_val_score to perform cross-validation on the data.
from sklearn.ensemble import GradientBoostingRegressor
from sklearn.model_selection import cross_val_score
model_validation = cross_val_score(GradientBoostingRegressor(), X, y, cv=5)
model_validation
Output:

Import Numpy and use the .mean() method to get the average of the cross-validation scores.
import numpy as np
np.mean(model_validation)
Output:
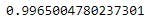
The model tends to be accurate with a 99.65% accuracy score, a very high score if you ask me.
After now, what next? This question is asked frequently by developers who want to move their models beyond Jupyter Notebooks. To use your model beyond the notebook environment, you need to serialize your model. Serialization means converting a python object into a format that can be stored and transmitted. It is done frequently with Pickle or Joblib.
In this article, Joblib will be used to serialize the model, and if you do not have Joblib installed, use pip install joblib to install it.
The joblib.dump() method saves a model, while the joblib.load() method loads the model.
Save the model using joblib.dump().
filename = 'calories_burnt.sav'
joblib.dump(model, filename)
Check your working directory for the saved model file.
Deploying the Model with Flask.
Flask is a web framework used for developing web applications using Python, implemented on Werkzeug and JinjaFlask is a micro web framework written in Python. It is classified as a microframework because it does not require particular tools or libraries. It has no database abstraction layer, form validation, or other components where pre-existing third-party libraries provide simple functions. - Wikipedia.
Why Flask?
- It is easy to scale for simple web applications
- It allows for technical experimentation
- It is easier to use for simple web application
- It is very flexible to use.
In the project structure for Flask, there is the static and templates folder. The static folder contains static files like CSS and JavaScript files, while the templates folder contains HTML files.
In this project, you will work with three files to create the web application to deploy your model, namely app.py, where you will write your python codes, index.html, for your index page, and style.css to style your HTML page.
To begin, create a folder in your current directory with the name templates, and inside, create a file named index.html; The HTML file creates a form to collect values for the workout activity to predict the calories burned during the workout session. The data sent from the HTML form are feature variables in our data.
index.html
<!DOCTYPE html>
<html lang="en">
<head>
    <meta charset="UTF-8">
    <meta http-equiv="X-UA-Compatible" content="IE=edge">
    <meta name="viewport" content="width=device-width, initial-scale=1.0">
    <link rel="stylesheet" href="https://stackpath.bootstrapcdn.com/bootstrap/4.4.1/css/bootstrap.min.css">
    <link rel="stylesheet" href="https://stackpath.bootstrapcdn.com/bootstrap/4.4.1/js/bootstrap.bundle.min.js">
    <link rel="stylesheet" href="https://cdnjs.cloudflare.com/ajax/libs/jquery/3.2.1/jquery.min.js">
    <link rel="stylesheet" href="{{url_for('static', filename = 'style.css')}}">
    <title>Calorie Burn Checker</title>
</head>
<body>
    <div class="register-photo">
        <div class="form-container">
            <div class="image-holder"></div>
            <form action="{{ url_for('predict')}}" method="post">
                <h2 class="text-center"><strong>Check</strong> the calorie burned.</h2>
                <h2 class="text-center">
                    {% if prediction_text %}
                        <strong>{{prediction_text}}</strong>
                    {% endif %}
                </h2>
                <div class="form-group"><input class="form-control" type="text" name="gender" placeholder="Gender" autocomplete="off" required></div>
                <div class="form-group"><input class="form-control" type="text" name="age" placeholder="Age" autocomplete="off" required></div>
                <div class="form-group"><input class="form-control" type="text" name="height" placeholder="Height" autocomplete="off" required></div>
                <div class="form-group"><input class="form-control" type="text" name="weight" placeholder="Weight" autocomplete="off" required></div>
                <div class="form-group"><input class="form-control" type="text" name="duration" placeholder="Duration" autocomplete="off" required></div>
                <div class="form-group"><input class="form-control" type="text" name="heartRate" placeholder="Heart Rate" autocomplete="off" required></div>
                <div class="form-group"><input class="form-control" type="text" name="bodyTemp" placeholder="Body Temperature" autocomplete="off" required></div>
                <div class="form-group"><button class="btn btn-success btn-block" type="submit">Check</button></div>
            </form>
        </div>
    </div>
</body>
</html>
Next, style the form using the code below. Ensure to put the CSS file in the static folder.
style.css
.register-photo {
    background: #f1f7fc;
    padding: 80px 0
}

.register-photo .image-holder {
    display: table-cell;
    width: auto;
    background: url(https://i.imgur.com/lcKFkTq.jpeg);
    background-size: cover
}

.register-photo .form-container {
    display: table;
    max-width: 900px;
    width: 90%;
    margin: 0 auto;
    box-shadow: 1px 1px 5px rgba(0, 0, 0, 0.1)
}

.register-photo form {
    display: table-cell;
    width: 500px;
    background-color: #ffffff;
    padding: 40px 60px;
    color: #505e6c
}

@media (max-width:991px) {
    .register-photo form {
        padding: 40px
    }
}

.register-photo form h2 {
    font-size: 24px;
    line-height: 1.5;
    margin-bottom: 30px
}

.register-photo form .form-control {
    background: transparent;
    border: none;
    border-bottom: 1px solid #dfe7f1;
    border-radius: 0;
    box-shadow: none;
    outline: none;
    color: inherit;
    text-indent: 0px;
    height: 40px
}

.register-photo form .form-check {
    font-size: 13px;
    line-height: 20px
}

.register-photo form .btn-primary {
    background: green;
    border: none;
    border-radius: 4px;
    padding: 11px;
    box-shadow: none;
    margin-top: 35px;
    text-shadow: none;
    outline: none !important
}

.register-photo form .btn-primary:hover,
.register-photo form .btn-primary:active {
    background: green
}

.register-photo form .btn-primary:active {
    transform: translateY(1px)
}

.register-photo form .already {
    display: block;
    text-align: center;
    font-size: 12px;
    color: #6f7a85;
    opacity: 0.9;
    text-decoration: none
}
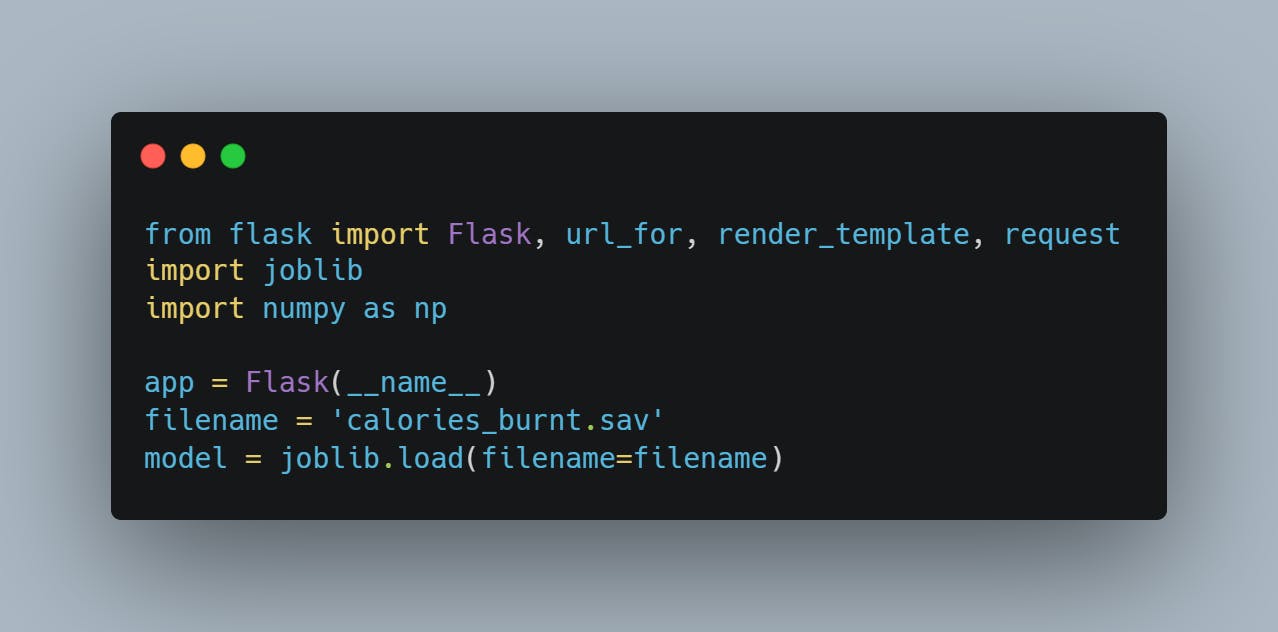
The app.py file is where all the action takes place. Take a look below.
app.py
from flask import Flask, url_for, render_template, request
import joblib
import numpy as np

app = Flask(__name__)
filename = 'calories_burnt.sav'
model = joblib.load(filename=filename)

@app.route('/')
def index():
    return render_template('index.html')

@app.route('/predict', methods=['POST', 'GET'])
def predict():
    if request.method == 'POST':
        try:
            gender = request.form['gender']
            age = int(request.form['age'])
            height = int(request.form['height'])
            weight = int(request.form['weight'])
            duration = int(request.form['duration'])
            heartRate = int(request.form['heartRate'])
            bodyTemp = int(request.form['bodyTemp'])
        except ValueError:
            error_message = "Please Ensure All Values Are Numerical"
            return render_template('index.html', prediction_text=error_message)

        gender = 0 if gender[0].lower == 'm' else 1

        prediction = model.predict(np.array([gender, age, height, weight, duration, heartRate, bodyTemp]).reshape(1, -1))
        output = round(prediction[0], 2)

        return render_template('index.html', prediction_text=f'You burned {output} calories today')
    else:
        return render_template('index.html', prediction_text='')

if __name__ == "__main__":
    app.run(debug=True)
So, what is going on here?
In this block of code, you import the libraries needed for the application, create an instance of the flask app using the name attribute, and load the model using the joblib.load() method with the filename passed to it.
Next,
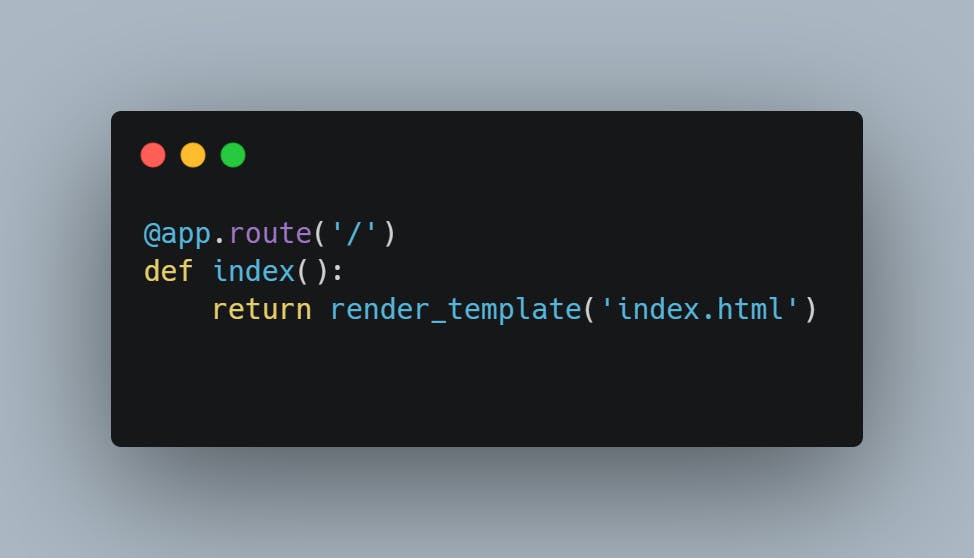
The app.route decorator maps the root URL to a function that renders the index page.
Now to the code that does the main work.
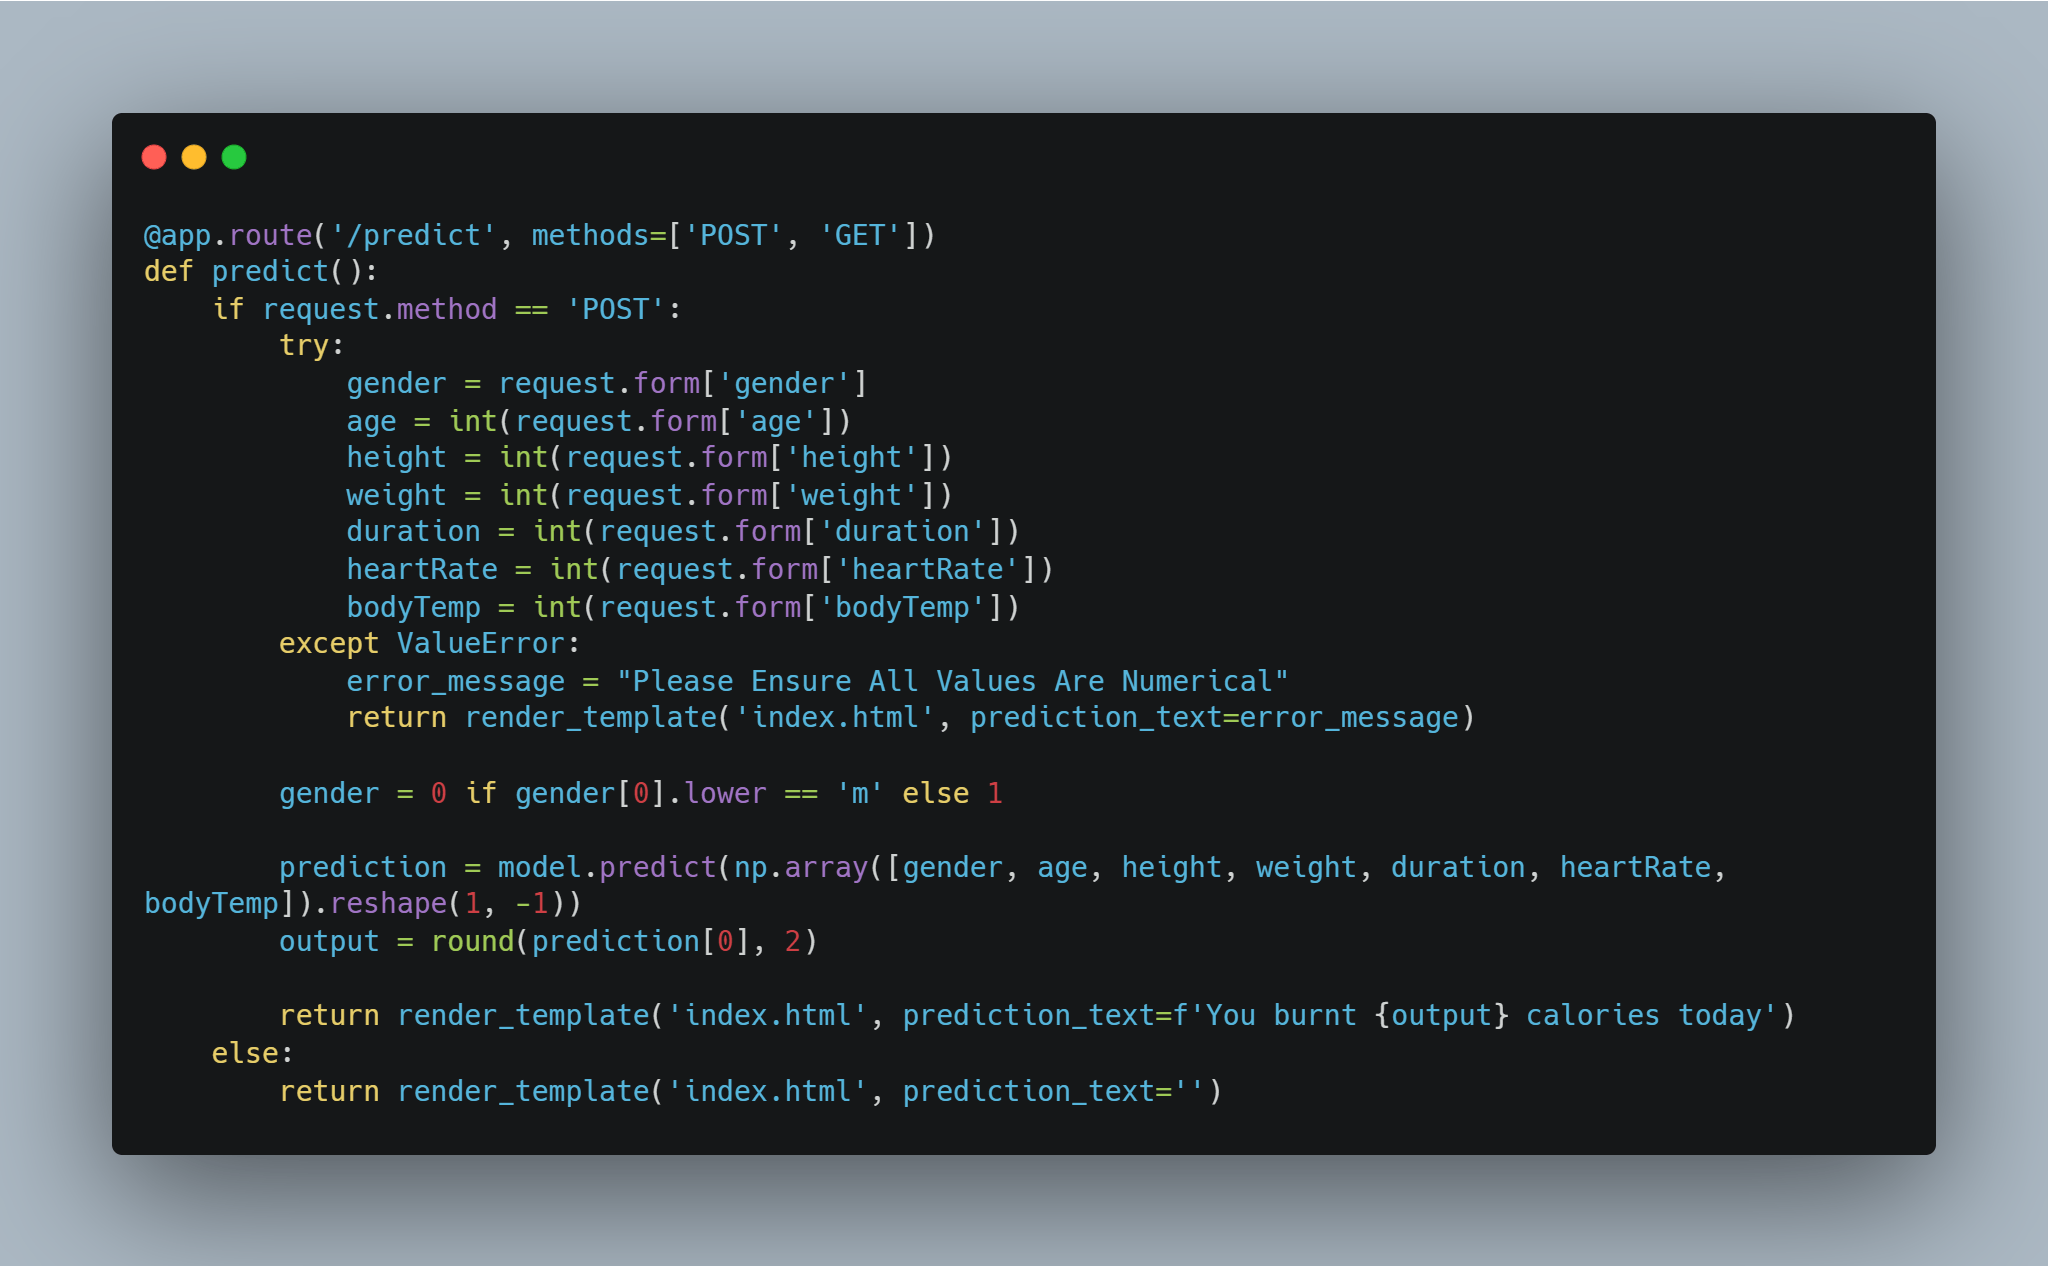
When the user fills the form and submits it, it initiates a POST request, and the values inputted are sent along with the request. The type of request when checked in the IF statement; if it’s a POST request, send the data using `request.form[‘the name of the input field’].
A try/except block catches the errors, peradventure the user fills letters instead of numbers in the input fields.
When an error occurs, the user sees an error message, and if no error occurs, convert all male entries in the gender field to 0 and female entries to 1, to match the value in the gender column. Finally, use the model loaded above the predict the calories burned, round the value to 2 decimal places, and return the value.
To run the app, open the terminal in the current directory, and run the application using python app.py. The web browser should open automatically and if not, type localhost:5000 in the search box.
Final Result
Conclusion
In this article, you analyzed the Calorie dataset, asked relevant questions about the data, and provided answers to them using data analysis, trained the Gradient Boosting Regressor Algorithm on the data, and deployed the trained model to Flask. Great job👍.
I hope this guide will be of use when building and deploying models sometime in the future. You can test your model by deploying your application using web services like Heroku and Streamlit.
Thank you for checking out this article. You can reach out to me on Twitter if you have any questions or suggestions.